How Much Will it Cost Us in the End?
“For one thing,” he says, “we’re not over budget at all, at this point. We’re estimating that, because construction costs are escalating so quickly in the current year, that next year, when we’re signing the remaining construction contracts, we’re going to see bids that will be higher than what we originally projected back in 2011-1012, when we put the finance plan together.”
Technically, this is true. In fact, the contracts for the first 60 percent of the project – including most of the planning, and the construction of the first 10 miles of the guideway, the rail operation center and the trains themselves – came in slightly under budget. The cost increases in question apply to the remaining 40 percent of the project. But these new estimates aren’t out of the blue. The higher projections stem from a series of contract bids that HART opened last December. These bids were, in some cases, 70 percent higher than expected.
Although Grabauskas canceled the solicitation for those contracts so they could be repackaged and rebid, it was clear that rail was going to cost more than projected.
The shortfall for rail right now is estimated to be $910 million (rounded up to $1 billion by rail critics.) Grabauskas, though, is quick to point out that not all of this is because of cost increases.
“When you say ‘$910 million,’ you really have to understand that the project costs are only forecast to increase by $600 million. The additional $310 million is income that has been removed from the project.”
That $310 million includes a projected shortfall of about $100 million in GET revenue that had been budgeted for the project, and the loss of $210 million in so-called 5307 funds. This was federal money from FTA’s Urbanized Area Formula Funding program, which supports urban bus and transit systems. This money had been penciled into the rail budget, but the Honolulu government now says it can only be used for the bus system.
Whatever the reason for the shortfall, though, HART has to come up with the missing $910 million. That’s because rail is a federally supported project. To get a Fully Funded Grant Agreement from the Federal Transportation Authority, which included the $1.55 billion in New Starts funds to help pay for Rail, HART and the city promised to fully fund the remaining costs. This is why the Legislature and the City Council reluctantly agreed to extend the GET surcharge until 2027. Less than full funding might mean construction delays or, worse, having to give the federal money back.
So, even using the rosiest estimates, we’re $600 million in the hole. How did we get there? More important, is the hole going to get any deeper? To answer these questions, it helps to take the big view.
GLOBAL PERSPECTIVE
In a much-cited paper published in the journal Transport Reviews in 2003, Danish researcher Bent Flyvbjerg and several colleagues compared the performances of 258 transportation infrastructure projects scattered across 20 countries around the world. The final cost of these projects ranged from as little as $1.5 million to as high as $8.5 billion (in 1995 dollars). For diversity, Flyvbjerg included 58 rail projects, 33 bridge and tunnel projects, and 167 road-construction projects. And, to get a historical perspective (i.e., are project planners getting any better at this?), the study spanned infrastructure projects completed between 1927 and 1998. This is still the most comprehensive survey of the performance of large transportation projects around the world.
The data aren’t promising.
“For a randomly selected project,” Flyvbjerg writes, “the likelihood of actual costs being larger than forecast costs is 86 percent.” Moreover, he says, those cost overruns are usually substantial. “Actual costs are, on average, 28 percent higher than forecast costs.”
It’s also worth noting that, according to the study, not all transportation infrastructure projects are created equal. Rail projects, like the one in Honolulu, are much more prone to cost overruns and those overruns tend to be higher. On average, these projects come in nearly 45 percent more than budgeted. For a $5.16 billion project like ours, that would amount to a $2.3 billion cost overrun – even if Honolulu simply cleaved to the average. Of course, Honolulu is hardly average.
So, the question is: How relevant are the Flyvbjerg data to Hawaii? His study, for example, includes many projects in developing countries in Africa and Asia, where graft and poor regulation tend to drive cost overruns higher. Doesn’t that make its findings less germane for a sophisticated project in cosmopolitan Honolulu? Perhaps. But the Flyvbjerg study also included a statistically relevant sampling of projects in the developed world and it turns out that, even if you only focus on those in North America – probably the best comparison for Hawaii, though still far from perfect – the average cost overrun is still nearly 41 percent.
What about the dates of the projects in the Flyvbjerg study? Even the most recent projects in his sample were completed 17 years ago. Has project planning improved dramatically since then? If so, the improvement would have to have been sudden. Remember, Flyvbjerg also segregated his data by time, which allowed him to test whether these projects became better at predicting future costs. Sadly, he wasn’t able to identify any statistical improvement in performance. Projects completed in 1998 were just as likely to be over budget as those completed in the 1920s, although the reasons might be different.
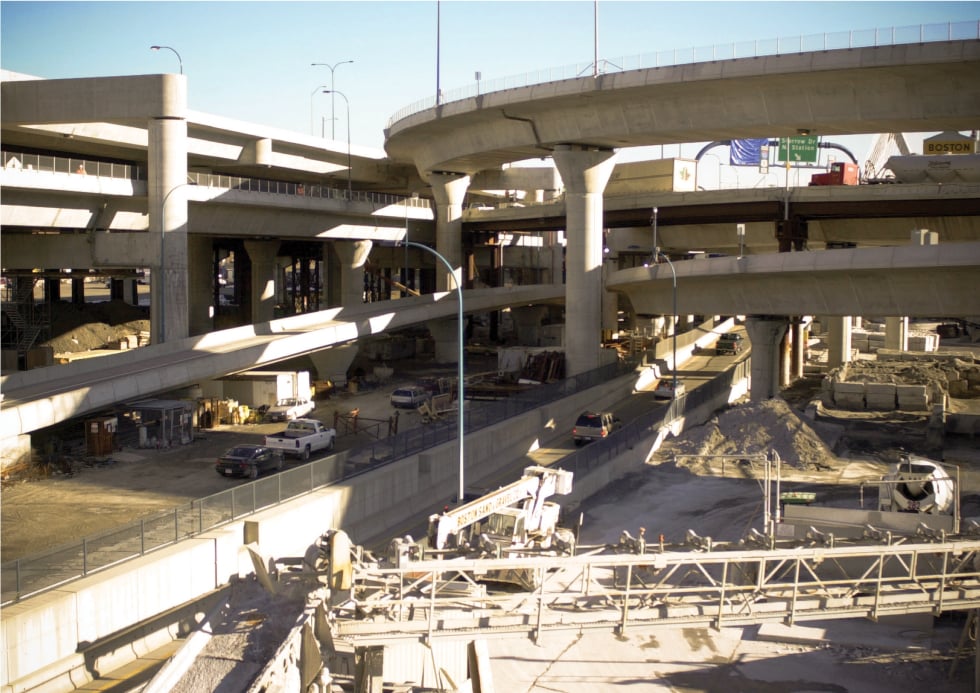
Boston’s “Big Dig” is probably the American transportation project most notorious for its cost overruns. Originally forecast to be completed in 1998 and cost $2.8 billion (in 1982 dollars), the project lasted until 2007 and cost about $9 billion in 1982 dollars. If you don’t use inflation-adjusted figures, the final cost was $24 billion.
AROUND THE COUNTRY
If Flyvbjerg’s data are relevant, the implications for the Honolulu Rail project are worrisome. But it’s true that some smaller, more recent studies aren’t as apocalyptic. A study of transportation projects in Indiana found that nearly 50 percent of highway projects were over budget, but the average cost overrun was only 9 percent. Similar studies in Washington state and Delaware identified average overruns of 10 percent and 13 percent respectively. These DOT-type studies, though, are small and focus almost entirely on highway construction and maintenance.
A larger, Northeastern University study compared projects around the country. It found that those completed in the 1980s had an average cost overrun of 50 percent, while the average cost overrun for those completed after 1994 declined to 30 percent. Unfortunately, because of a few outliers, these findings weren’t statistically significant. Interestingly, unlike in other studies, the cost overruns for rail projects, like ours, start lower, but the decline is much less pronounced: down from 27 percent to 20 percent.
 Not all such recent studies were more optimistic. Randal O’Toole, a rail critic who blogs as “The Antiplanner” for the libertarian Cato Institute, has compiled a disturbing table of data, drawn largely from the FTA New Starts program. O’Toole found that rail projects finished in the 2000s were, on average, 45 percent over budget. Even more alarming, he says projects ending since 2010 have been cumulatively 77 percent over budget.
Of course, not all these projects are appropriate comparisons for a project on the scale of the rail line in Honolulu. But if you run your finger down the columns in O’Toole’s table, you can compare apples to apples – albeit somewhat anecdotally. According to him, the $1.8 billion Central Link light-rail project in Seattle came in 38 percent over budget; Phoenix’s $1.07 billion East Valley light-rail project was 31 percent over budget; San Francisco’s $1.2 billion airport heavy-rail project, 30 percent over budget; and Los Angeles’ $3 billion heavy-rail Red Line project, 47 percent over budget.
Then there’s Boston’s infamous Big Dig, a gargantuan infrastructure project with an even more gargantuan cost overrun. Originally forecast to be completed in 1998 and cost $2.8 billion (in 1982 dollars), the project ultimately lasted until 2007 and finished with roughly a $9 billion price tag. That’s a 190 percent cost overrun.
But the Big Dig is also a good example of how critics and the media can sometimes misrepresent the data on big infrastructure projects. Often, those cost overruns are characterized as going from $2.8 billion to $24 billion. While this may be technically correct, it ignores inflation. The first figure is in 1982 dollars, while the second is in current dollars. So, although such reports are useful to help put things in context, the studies often require context themselves. For example, O’Toole’s self-professed bias against planning, and against large government projects in general, means we have to be (like the original Cato) a little skeptical of both the study’s data and conclusions.
A good example is Sound Transit’s Central Link light rail, which opened in 2009, connecting downtown Seattle with Sea-Tac International Airport. O’Toole attributes a 38 percent cost overrun to the Central Link project. But, according to Bruce Gray, spokesman for Sound Transit, which operates Central Link, the $2.7 billion project actually came in on schedule and $137 million under budget. Similarly, Sound Transit’s next project, the $1.8 billion University Link subway, is expected to open next year, $150 million under budget and more than six months ahead of schedule.
Gray attributes the success of these projects to good management and lucky timing. (Sound Transit contracted for most of the work during the Great Recession, when construction was cheap.) But the main difference between O’Toole’s numbers and Sound Transit’s numbers is a function of when you start counting. O’Toole bases his calculation on the earliest, most optimistic estimates of Link advocates, dating back to the early 1990s. Sound Transit, on the other hand, uses the date of the Full Funding Grant Agreement with FTA as its starting point. As Gray puts it, “Everything we’ve done since the official scope of the project and the project schedule were set by the FFGA has been done under budget and on schedule.”
So, which numbers are more relevant? Rail advocates say the FFGA numbers best reflect the cost of the project that the community actually commits to. For example, Hawaii’s FFGA numbers represent the rail system that HART, the state, the City and County of Honolulu, and the FTA agreed to fund and build. FFGAs are, in effect, the contractual obligation for the project (though that will change as the project progresses). But critics such as O’Toole and Flyvbjerg say that misses the point. In most cases, the numbers used to persuade decision makers, politicians and voters to build the project in the first place come earlier in the process and contain much more optimistic estimates of costs and benefits.
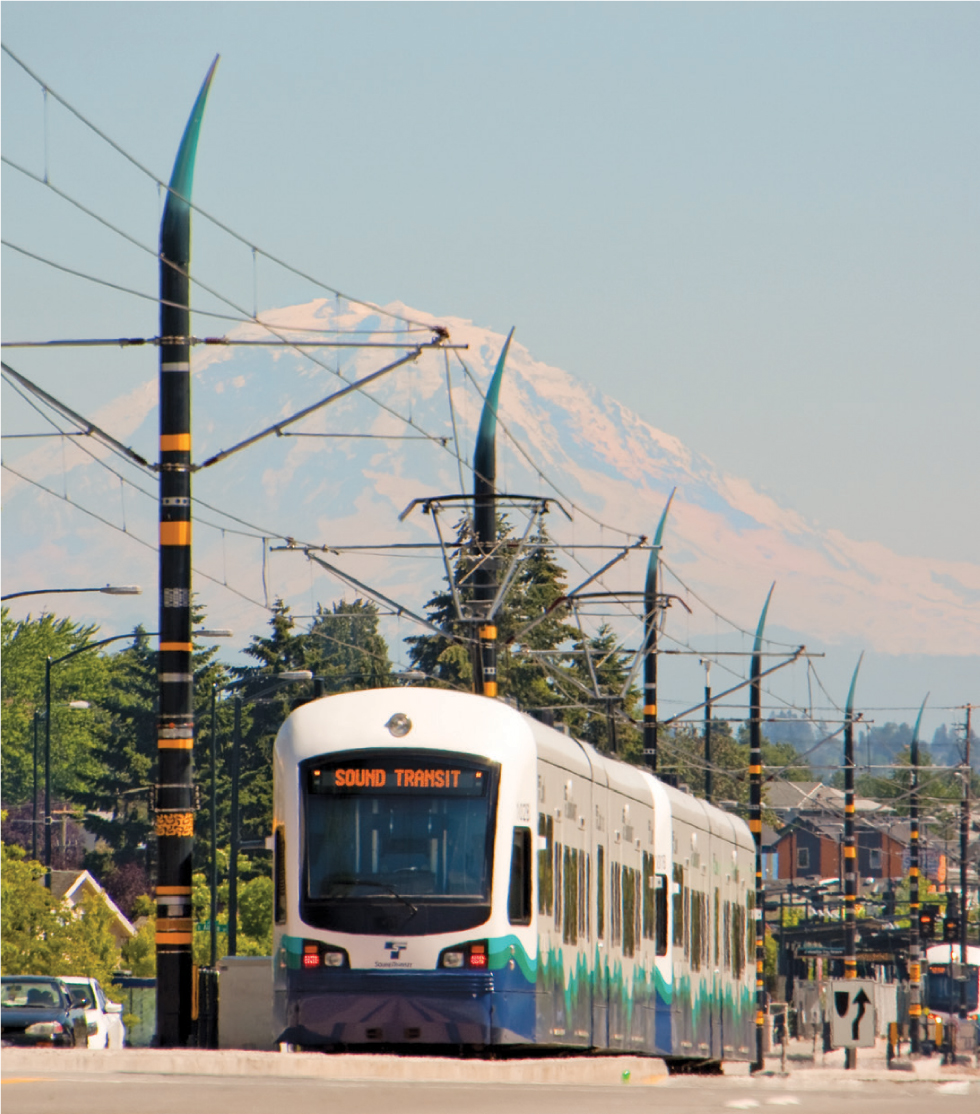
The Central Link rail line, which cost $2.7 billion to complete, connects downtown Seattle with Sea-Tac International Airport. PHOTO: COURTESY OF SOUND TRANSIT
It’s not just cost estimates that change. The scope of projects often changes dramatically from the time the decision is made to pursue a project and the time an FFGA is signed. For example, Honolulu City Councilwoman Ann Kobayashi, now a staunch critic of Honolulu’s rail project, says she supported the original plan. She says she changed her mind, in part, because the FFGA plan no longer matched what she agreed to.
“There was an understanding,” she says, “that the train would cost $3.5 billion, and it would go to UH Manoa, it would go to Waikiki and it would go through Salt Lake. Forty-thousand people live in Salt Lake. All these people voted for it. But, after the vote was taken, the route changed to the airport rather than Salt Lake; it wasn’t going to Waikiki because the businesses there didn’t want it; and now it’s not going to UH. Plus, the cost is twice as much.”
WHAT CAUSES OVERRUNS
Bent Flyvbjerg has made something of a career of analyzing and reanalyzing the cost overrun data from his groundbreaking 2003 paper. He doesn’t believe the systematic underestimation of costs can be attributed to simple error or bad luck. In the conclusions of the original paper, he gets right to the point:
“We conclude that cost estimates used in public debates, media coverage and decision making for transport infrastructure development are highly, systematically and significantly deceptive.”
In a subsequent paper, he writes: “Underestimation cannot be explained by error and is best explained by strategic misrepresentation, i.e., lying. The policy implications are clear: In debates and decision making on whether important transportation infrastructure should be built, those legislators, administrators, investors media representatives and members of the public who value honest numbers should not trust the cost estimates and cost-benefit analyses produced by project promoters and their analysts.”
And it’s not just costs. Flyvbjerg finds similar reason for skepticism on the revenue side. For example, planners systematically overestimate ridership for light-rail systems like the one being built in Honolulu. On average, Flyvbjerg found actual traffic was 39.5 percent lower than forecast, and 75 percent of the projects had ridership shortfalls of at least 25 percent. This anemic traffic further weakens the project’s dubious cost-benefit analysis.
This, too, Flyvbjerg attributes to misinformation – lying, as he puts it – rather than honest error. He recommends treating this kind of misinformation as a crime, suggesting the use of “financial, professional and even criminal penalties” to goad planners and consultants into honest, forthright budget projections. It’s not clear that any of this kind of explicit misrepresentation happened during the vetting of the Honolulu rail project (though critics have claimed as much); but, even if it did, those numbers are baked in the cake now, as far as HART is concerned. Because of the nature of the FFGA, the project has to be constructed pretty much as planned, whether the original financial assumptions were right or wrong. The most useful approach now is to focus on the cost increases that you can control.
“ACTUAL COSTS ARE, ON AVERAGE, 28 PERCENT HIGHER THAN FORECAST COSTS.”
–BENT FLYVBJERG, Professor and expert on construction-cost projections, Oxford University
In a 2013 paper, Flyvbjerg addresses this by focusing on the structural, rather than political causes for cost overruns. He tests whether the duration, size or ownership of the project affects the scale of the budget overrun. Interestingly, he finds no evidence implicating the size of a project in its going over budget. (Good news for our giant rail project.) Similarly, he finds no proof that private ownership is more efficient than public ownership or ownership by a public corporation, like HART. It turns out that time – how long the project lasts – is the key. The longer a project takes to complete, the greater the chance that unforeseen events will add to the cost.
Flyvbjerg puts a number to this: For every year from the decision to build until operations begin, the average increase in cost escalation is 4.64 percentage points. Sluggishness, he says, can be expensive. “If those responsible for a project fail to take such precautions aimed at proactively preventing delays and long implementation phases, the evidence indicate that the financiers – be they taxpayers or private investors – are likely to be severely penalized.”
HONOLULU’S DELAYS
That’s certainly been the story for HART. In fact, Grabauskas attributes most of rail’s $600 million projected cost overrun to the delays caused by lawsuits: not just the Supreme Court challenge that stopped the project for 13 months, but also a succession of bid challenges by contractors wrangling for a piece of the action. Collectively, Grabauskas says, all this litigation has moved the project from a period of cheap construction into an expensive construction boom.
“In 2012,” he says, “we were putting the final touches of the finance plan in place in preparation of getting an award from the federal government for our full funding grant. It took about a year to put that together. Then, in August 2012, the (Hawaii) Supreme Court rules that we have to halt construction and do this archaeological survey work.” This set up a 13-month delay during which the economic climate for construction completely changed.
To see how delays can affect costs, it’s useful to look at the specifics of the Honolulu rail project. Obviously, because of the legal fees involved, the lawsuits themselves added directly to the cost of the project. But, according to Grabauskas, it was the delay claims by the contractors that accounted for most of the $40 million in delay costs. In a sense, these delay claims are straightforward, he says. “In a contract, one of the provisions is that I tell you when to mobilize. In order to mobilize, you need to hire people, you need to get equipment, you need to lease office space and put together all the infrastructure so that, on a given day, when you’re supposed to start work drilling shafts to build columns, you’re ready to do that. They did all that in April 2012, and began physical work in the field. Then, in August, they got shut down. Literally, on a Friday, the decision came out, and on Monday, I had to say, ‘Cease all work.’ ”
“Under the provisions of the contract, the contractor had a right to come to us and say, ‘Well, we’re not working not because we can’t deliver you people, power and equipment. We’ve stopped because you told us to stop.’ That means we were liable to reimburse any expenses they incurred.”
The hiatus, because its duration was unknowable, also set up an expensive juggling act, Grabauskas says. “The contractor would say, ‘OK, here’s a piece of equipment that we shipped out to the island. Do you want it to stay here, or can we ship it to another job?’ And we had to make a calculation. If we shipped it off-island, we didn’t know when we were going to get the approval to restart construction. We might say, ‘Hey, we just got the approvals,’ and they would say, ‘OK, it’s three months to get the equipment back.’ So, in some cases, we were paying them for idle work, idle equipment and offices. We told them, ‘We want you to maintain a certain degree of readiness, with certain key personnel and certain key equipment, because we don’t want to lose any time, once we get our approvals, getting back to business.’ ”
But these direct costs are small change in the grand scheme of a $5.16 billion project. The biggest cost from the delay – the one that Flyvbjerg’s paper alludes to – came from the unpredictable swing in the economy. Here, it’s worth quoting Grabauskas at length:
“If you looked at how much construction costs were rising each year, what you’d see is that in 2009, when the first contracts were put out on the street, and part of 2010, we had negative inflation, or deflation. Costs were actually going down on the Island, and the first construction contracts that went out actually came back under budget. In 2011 or 2012, when we were supposed to be bidding the things that we’re bidding right now, inflation was between 3 percent and 5 percent for construction. It was post-recession and things were starting to get better, but they were still bad. But, last year, construction inflation on the island of Oahu was 14 percent and it’s still expected to be between 12 percent and 14 percent this coming year and the year after that.” This inflationary pressure, he says, is what drove up costs. By way of comparison, remember that Seattle’s Central Link, which started at more or less the same time, proceeded on schedule and came in under budget.
“THE PROBLEM I S THAT OUR PROJECT IS SO COLOSSALLY LARGE THAT A FEW PERCENTAGE POINTS, ON THE INCOME SIDE, ADDS UP TO OVER $ 100 MILLION.”
–DAN GRABAUSKAS, Executive director, Honolulu Authority for Rapid Transportation
Of course, HART and the FTA weren’t oblivious to the changes in economic conditions. In fact, in a risk assessment earlier in 2014, they estimated costs might increase by as much as $260 million. That turned out to be less than half of the increase in the new projection. It was only through extensive consultation with contractors and some creative repackaging of contracts that HART got the overruns down to $600 million. And even that assumes the project doesn’t face substantial interruptions again.
FINAL TALLY
That’s the rub. First of all, the repackaging and rebidding of the project’s remaining contracts has taken time and will likely stretch out the project, especially if the new contracts are also contested by losing bidders. More distressing is that even the existing contracts seem to be falling behind schedule. The March 2015 report by Jacob Engineering, the project-management oversight consultant for the FTA, is riddled with allusions of delay: The West Oahu/Farrington Highway Design- Build contract is four months behind schedule. The Kamehameha Highway Guideway is seven months behind schedule. The Navy is still denying contractors the access they need for work on the Airport Guideway. And ongoing problems with HECO have stymied the utility work necessary to keep the project moving. Remember, these problems and delays are on the easiest portion of the project. The possibility the project drags out only increases as work moves into the urban core.
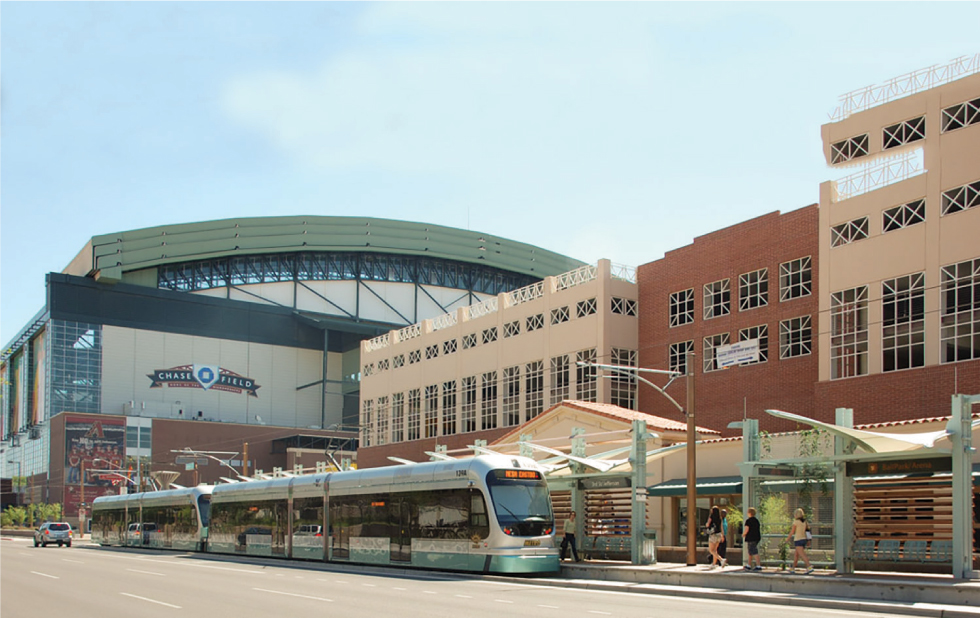
Phoenix’s East Valley light-rail project cost $1.07 billion, which put it 31 percent over budget, says rail critic Randal O’Toole. He gets his starting figure from the estimate of a project’s cost when the initial political debate is going on and a yes-or-no decision is being considered. Pro-rail advocates tend to use a later initial cost estimate: the date of the Full Funding Grant Agreement with federal officials. PHOTO: COURTESY OF VALLEY METRO RAIL
Grabauskas agrees. He gives the example of how dealing with a procurement issues can cause unexpected delays. In this case, the second-lowest bidder challenged a contract award. That procedure has delayed the project’s 2018 interim opening by three months. And this is just one perfectly legal and completely unsurprising incident. Between now and 2018, there will be hundreds of opportunities for these sorts of procedural delays.
Then there are the issues, like traffic control and moving utilities – not to mention bones – that come from working in town.
“When we come into the city center area,” Grabauskas says, “can we maintain the traffic and keep the city open for business while we’re doing construction? If we’re going to have pressures on us (and I think we will) to not work during travel time, then that limits our ability to meet the schedule.”
In some instances, he says, slowing the project may even be desirable. “I can’t really see us shutting down Dillingham Boulevard or Nimitz Highway or Ala Moana while we’re doing that work. Realistically, we have to understand we cannot do that. Therefore, should we take into account more time? … I think most people in the community would understand if it took a little longer, but the traffic was going to be mitigated, and that, frankly, costs would be more controlled because companies wouldn’t have to factor in the risk of dealing with all that.”
Despite this realistic take on the challenges facing the project, Grabauskas is still basically optimistic. Even given all the problems HART faces, he still estimates the project will only cost 10 percent to 15 percent more than predicted at the outset, which, as we’ve seen, compares well against other rail projects around the country. And, as he emphasizes, it means the 2007 estimates – both for costs and revenues – weren’t that far off track.
“For the estimates that were created back in 2007 for GET revenue, we’re tracking cumulatively about $30 million off of what we thought we would have at this point. That’s $30 million off of $1.4 billion that’s been collected. Our estimates are that, in the end, we might be $100 million off of the $3.5 billion that we will eventually collect. So, if we end up being $100 million off on $3.5 billion, that’s just a couple of percent off. And that’s over the period from 2007 to 2022, which included one of the deepest recessions we’ve ever seen in the United States.
“So, as with everything in this project, it’s not the percentages that are bad. Being a couple of percent off on income – that’s pretty good, given all we’ve had to suffer. It’s the same being 10 percent to 15 percent over on construction. The problem is that our project is so colossally large that a few percentage points, on the income side, adds up to over $100 million, and, on the cost side, to over $600 million. That’s the challenge for this project. I know those numbers stagger people, and they should. We take them very seriously. But, managing the project to the percentages that we’re talking about I think should probably put us in a favorable light compared to other projects around the country.”